Business Intelligence tools : The Guide to pick your software
The year 2023 will be noteworthy for data enthusiasts, as companies will need to maintain a cutting-edge approach to data architecture to remain competitive. Business Intelligence (BI) tools will continue to be crucial in this field. In our previous article, we provided a clear distinction between the two leading BI software: Power BI and Tableau (Power BI vs Tableau • HeadMind Partners).
In this article, we aim to take a more in-depth look at the tools that are commonly used in the market.

The Juggernauts
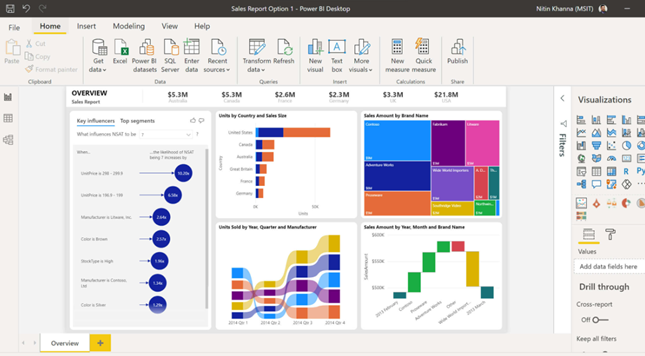
Microsoft Power BI
The software is developed by Microsoft, which initially released Power BI in 2011 with the goal of creating a user-friendly interface. Today, Power BI is the leading Business Intelligence tool with a market share of 36% (according to 2021 figures). This tool has many features that could make it a market leader, but its main advantage is its seamless integration with the Microsoft environment. Furthermore, it is a non-code solution that can connect to various types of data resources and has many visualization options, which removes many barriers for the user.
On the downside, some find Power BI difficult to master when they need more complex analysis, such as using DAX functions. If you have an Office 365 subscription, you may already have access to Power BI Pro at no additional cost. If it’s not the case, you can purchase this latter for $9.99/month/user. However, if you need more advanced features for business purposes, Power BI Premium costs $20/month/user to access additional functionalities.
Pros
- Integration with Microsoft environment.
- Capacity of data treatment and extremely quick with small dataset.
- “Endless” solution of visualization options style thanks to the marketplace.
- Low licensing costs compared to other BI tools.
Cons
- Only operates on Windows environments. No IOS or Linux possibilities.
- The DAX language is not the easiest.
- A bit slow when managing extremely large datasets.
Tableau
Tableau Software was created back in 2003 in the US. In 2019, SalesForce bought the company, and in 2021, Tableau Desktop (the actual BI visualization platform) counts for 20% of the BI software market share.
Tableau Software is offering an end-to-end solution to data analytics for companies and a non-code solution. With Tableau, it is possible to connect to various types of data resources.
In terms of licensing, you have three different models going from 15€/months/users for the most lighted version to 70€/months/users for the full end-to-end package.
Pros
- Integration with the SalesForce environment.
- Operates on any computer operating system.
- Connecting two different dataset is relatively “easy”.
Cons
- The price is on the high range (higher than Power BI).
- More oriented towards data “specialists”.
- Same as Power BI, a bit slow when managing extremely large dataset.
Qlik
Qlik was launched in Sweden in 1993, initially focusing on in-memory analytics. Over time, it evolved into a BI platform. In 2010, Qlik went public and has since broadened its offerings to include both cloud and on-premises data visualization and analysis solutions. Our research shows that this tool ranks third in terms of market share with 11%.
The benefits of this BI software include:
– Advanced data preparation,
– Good performance with large data sets and
– Efficient data visualization, especially for various chart groups.
Data association is also a strength compared to other BI solutions:
Qlik is a non-query-based platform and it enables the user to identify connections or patterns in data that other BI tools may have missed. The regular cost for licensing is $30 per user per month. However, the price can be subject to negotiation, in case of enterprise software as a service (SaaS) solutions.
Pros
- Good performance with large set of data
- Both a cloud and an end-to-end BI tools
- Ease of use
Cons
- Needs a strong computer system to run properly
- Support and customer service
- Often needs purchasable adds-in to get what you really want out of the data
The contenders
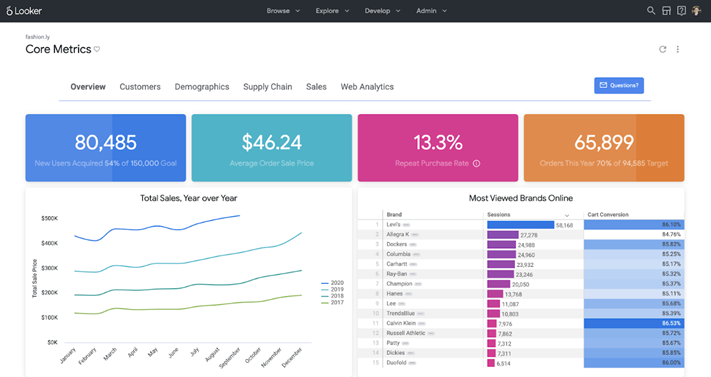
Looker
Looker was launched back in 2012 in the US and is a business intelligence as well as a big data analytics platform.
In 2019, Google bought it and the software is now part of the Google Cloud Platform (GCP). Looker is a browser-based platform and comes with its data modeling based on its unique modeling language, the LookML (SQL based). Looker is not an end-to-end data analytics software like Tableau Software or Microsoft Power BI.
A place to store and manage the raw data is needed on top of it, although Looker is able to work with any kind of data resources it might be a blocking point.
In terms of costs, it is quotation-based only and seems to be on par with the industry standard, although a bit higher.
Pros
- It is a browser-based platform. A URL link is all you need to access a dashboard.
- It is part of GCP.
- The LookML is a force. You can model pretty much anything…
Cons
- …but it is not an end–to—end data analytics tool. Data needs to be moved to Looker to be treated.
- You need to (basically) create “everything”, the initial set-up is costly, long and major.
- Perhaps not recommended to small enterprises or start-ups due to the set-up processes
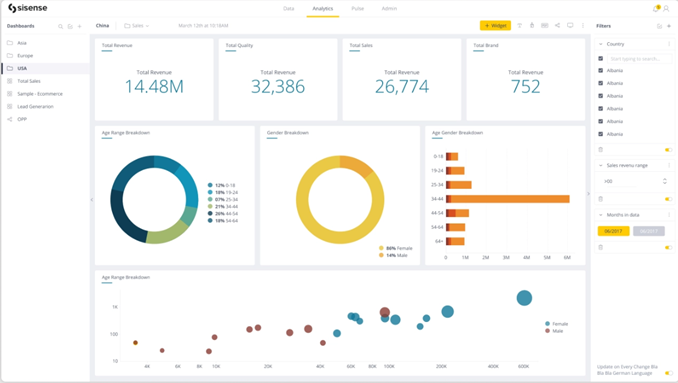
Sisense
Sisense is a software company, founded in 2004 in Tel-Aviv. It offers a platform for data analysis and business intelligence.
Sisense’s platform is known for:
– Its customizability services for companies,
– User-friendly interface with drag-and-drop functionality,
– The ability to process large and complex data sets.
Despite these strengths, some users may find the costs of the software to be a limiting factor, and there have been reports of limited integration options with other tools. It’s important to say that the cost of Sisense is not very clear, as the information available is inconsistent. However, based on user feedback, Sisense is generally considered a more expensive tool compared to other BI solutions and is quotation-based.
Pros
- AI is at the center of dashboarding. Makes the tool smooth and efficient.
- The customizability services are top tier in the industry making it accessible to any companies.
Cons
- It is one of the most expensive tools on the market
- Limited in term of data integration tools (R,Python etc)
Marc Laurière. & Térence Bricout.
- 5 Business Intelligence Tools You Need to Know | Coursera
- Analysis of Selected Business Intelligence Data Visualization Tools – ProQuest
- Analytics and Business Intelligence Platforms Reviews 2023 | Gartner Peer Insights
- Power BI vs Tableau: Which Should You Choose in 2023? | DataCamp
- What Can You Do With Power BI? 5 Top Power BI Ideas | DataCamp
- Microsoft Power BI Software Reviews & Ratings | 2023 | Software Advice
- What Can You Do With Tableau? 3 Top Tableau Ideas | DataCamp
- Plate-forme d’informatique décisionnelle et analyse intégrée Looker | Google Cloud
- ▷ Looker Tutorial – What is Looker and How Looker Works (mindmajix.com)
- Qlik Sense | Modern Cloud Analytics
- Comparison of BI and Analytics Platforms | DataCamp
- Sisense – The Knowledge to Act