

Power BI vs Tableau
Business intelligence (BI) tools are software applications that help organizations to analyze and better understand their data. They can be used to create reports, dashboards, and visualizations that help organizations make informed decisions and track the performance of their business. Some common features of BI tools include:
- Data connectors: BI tools often have a wide range of built-in data connectors that allow you to connect to and import data from a variety of sources, such as databases, spreadsheets, and cloud applications.
- Data visualization: BI tools typically include a range of visualization options, such as charts, graphs, and maps, which allows you to present data in an easy-to-understand format.
- Data modeling: BI tools often include features that allow you to build models and perform calculations on your data, helping you to better understand trends and patterns.
- Collaboration and sharing: Many BI tools include features that allow you to share your reports and dashboards with colleagues and stakeholders, helping to facilitate collaboration and decision-making.
BI tools can be used in a variety of industries and for a wide range of purposes, including sales analysis, marketing analysis, financial analysis, and more. The article will focus on the two most popular BI tools used by organizations: Power BI and Tableau.
What is Power BI?
Microsoft Power BI is a business intelligence (BI) and data visualization tool developed by Microsoft that allows you to connect to, visualize, and analyze data from a wide range of sources. Interactive dashboards and reports can be created to help organizations having a better understanding of their data and make informed decisions.
Power BI is available in both a free and paid version. The free version includes basic features such as data visualization and collaboration, while the paid version includes additional features such as advanced data modeling and premium connectors. Power BI is often used by business analysts and non-technical users for tasks such as data visualization and reporting.
What does Power BI offer?
- Data modeling: Power BI allows users to create relationships between different data sources and build a model of their data. This can help users better understand their data and create more accurate and insightful reports and dashboards.
- Data visualization: Power BI includes a range of charts, graphs, and other visualizations to help users make sense of their data. Users can customize the look, feel of their visualizations, and create interactive dashboards to explore their data.
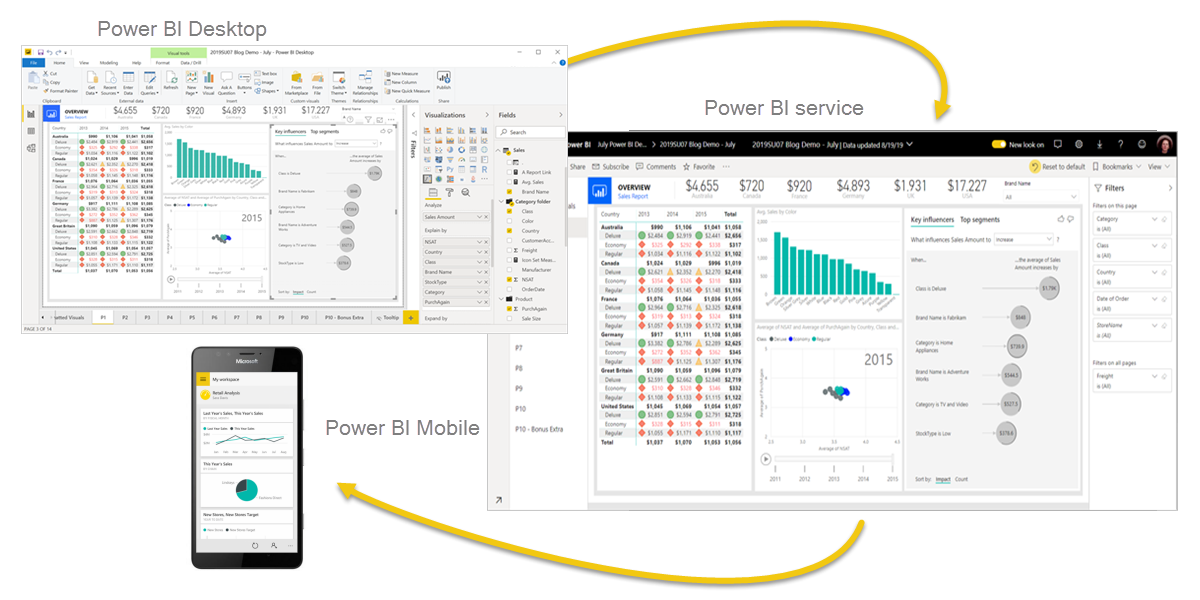
- Dashboarding: Power BI allows users to create dashboards that display a variety of visualizations and other information in a single view. Users can customize the layout and content of their dashboards and share them with others.
- Data connectors: Power BI possesses connectors to various data sources, including Excel, SQL Server, and cloud services like Azure and Google Analytics. This allows users to easily bring in data from a wide range of sources and create reports and dashboards based on that data.
- Collaboration: Power BI allows users to share their reports and dashboards with others and work on them together in real-time. Users can also use Power BI’s mobile app to access their dashboards and reports on the go.
- Integration with other tools: Power BI integrates with a number of other tools, including Excel, Azure, and Dynamics 365, allowing users to bring in data from these sources and create reports and dashboards based on that data.
What is Tableau?
Tableau is an interactive data visualization tool from Tableau Software, a data visualization company headquartered in the United States. It was founded in 2003 by Pat Hanrahan, Christian Chabot, and Chris Stolte. It has been acquired by Salesforce in 2019.
Gartner listed Tableau as a leader for the 10th consecutive year in their 2022 Magic Quadrant for Analytics and Business Intelligence platforms.
What does Tableau offer?
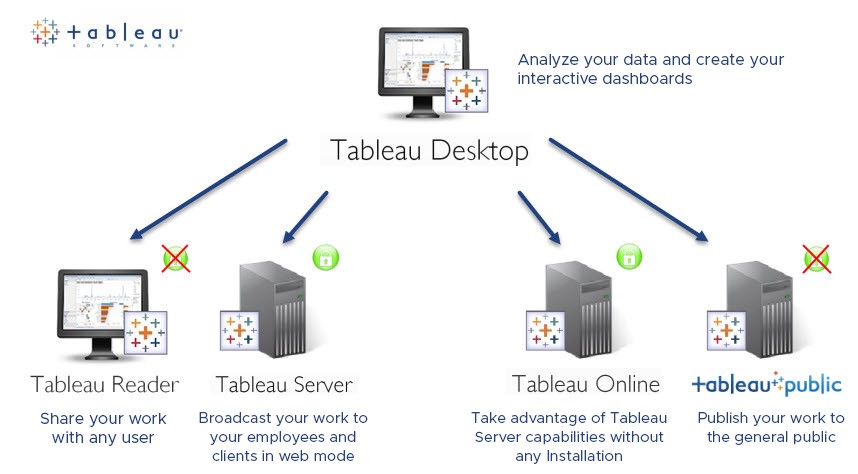
- Tableau Server: Enterprise-level online platform to manage data and data sources
- Tableau Online: Cloud-based analytics platform makes sharing and collaboration easy
- Tableau Desktop: Self-service business analytics and data visualization tool
- Tableau Prep: A visual and direct interface to make data preparing easy and advanced
- Tableau Reader: A free desktop application to view and interact with data visualizations
- Tableau Mobile: Access data wherever, whenever with Tableau Mobile Apps
Comparison Tableau vs Power BI
Here are some key differences between the two tools:
Data Connectivity: PowerBI is designed to work with structured data, such as data from relational databases or Excel spreadsheets. Tableau, on the other hand, is more flexible and can work with both structured and unstructured data, such as data from text files or web-based data sources. This means that Tableau may be a better choice for users who need to work with a wider variety of data sources.
Pricing: PowerBI is a subscription-based service, with different pricing tiers that offer varying levels of features and capabilities. Tableau, on the other hand, offers a variety of pricing options, including a subscription-based model and a perpetual license model. This means that users have more flexibility when it comes to choosing the pricing model that best suits their needs and budget.
Dashboarding and Visualization : Both Tableau and Power BI offer a range of visualization options and allow users to create interactive dashboards. However, Tableau is generally considered to have more advanced visualization capabilities, with a wider range of chart types and options for customizing visualizations. Power BI also has a range of visualization options, but they may not be as extensive as those in Tableau.
Usability: Power BI can be used by even a non-experienced person and offers insights and data analytics using drag-and-drop features. Tableau does provide the same but some prior knowledge of data visualization and big data helps analysts to better leverage it.
Which Is Better Power BI vs Tableau? What To Choose and When?
The choice between the two will depend on the specific needs and requirements of your organization, including the type of data sources you need to connect to and the level of customization and advanced visualization capabilities you require. The budget and the specific needs and preferences of the users might also be taken into consideration.
Power BI is suitable for small teams with limited resources, and Tableau, on the other side, is known for its bulk data handling capacity and suitable for medium and large enterprises.
https://www.statista.com/statistics/590054/worldwide-business-analytics-software-vendor-market/
https://learn.microsoft.com/en-us/power-bi/fundamentals/power-bi-overview
https://cloud.google.com/resources/looker-gartner-magic-quadrant
https://medium.com/p/bf8591d03f09
https://www.statista.com/statistics/590054/worldwide-business-analytics-software-vendor-market/
https://datascientest.com/power-bi-vs-tableau
https://kpsconsultingsas.fr/en/nos-expertises/tableau-software/
https://cloud.google.com/resources/looker-gartner-magic-quadrant